All VLAB products build from the VCORE Platforms
Our virtual core platform (VCORE) provides the foundational detailed analysis of your oil and gas reservoir by uniquely combining micro-CT and SEM imaging with proprietary advanced AI algorithms to create an unrivalled virtual core view which accurately represents the 3D distribution of minerals, fractures and pores, delivering you reliable and cost-effective reservoir characterisation.
VCORE PLUG PLATFORM
Using fast high-throughput scanning combined with proprietary advanced AI algorithms, our virtual core platform (VCORE) uniquely provides a highly accurate virtualised 3D mineralogy view of the whole core, allowing you to quickly gain significantly increased understanding of your entire oil and gas reservoir characterisation than competing solutions offer.
VCORE WHOLE-CORE PLATFORM
Using proprietary virtualisation techniques, our service provides a complete 3D physical analysis of a whole-core to more accurately distinguish all fractures, minerals, fluids and the pore system than you could achieve using conventional digitisation or conventional lab, allowing you to gain a greater understanding of your reservoir and ultimately maximise production.
Digital MICP, RCA properties from reservoir material unusable for l Property relations for each rock type within heterogeneous plugs
Applications & Advantages
- Sample size up to 2.5” diameter core
- Micro-CT resolution down to 1 µm
- Properties from poorly consolidated or damaged plugs, irregular pieces and cuttings, unusable for lab analysis
- Property relations for each rock type within heterogeneous plugs
- VCORE porosity and mineral distributions guide RCA property upscaling from subplug to plug.
- Permeability-porosity curves or elastic properties simulated before/after dissolution or removal of selected minerals.
Deliverables
- VCORE with micro-CT imaging and 3D mineral mapping both on sample and at higher resolution on sub-plug(s) for dominant rock type(s) present
- Distribution statistics of porosity, resolved grain size, pore surface and interfacial area, pore and throat sizes per rock type and per mineral
- Permeability-porosity directional k(ф) curves simulated per rock type (> 10 mD)
- Formation resistivity factor FF(ф) curves and exponent m simulated per rock type
- Optional pore network extraction.
VPETRO Example: Damaged and Heterogeneous Material
Applications & Advantages
- Two-phase flow properties from reservoir material unusable for lab analysis
- Property relations for each rock type within heterogeneous plugs
- Imaged drainage/imbibition lab experiments on representative subset of sub-plugs then used to assign realistic wettability states and contact angles to flow simulations on remainder of subplugs.
- VCORE porosity and mineral distributions guide SCAL property upscaling from subplug to plug and build wettability correlations.
Deliverables
- VCORE with micro-CT imaging and 3D mineral mapping on sample and on subplug(s) for dominant rock type(s) present
- Simulation of two-phase kr(Sw) and Pc(Sw) for primary drainage
- Simulation of two-phase kr(Sw) and Pc(Sw) for imbibition with wettability input from mineralogy and:
- Micro-CT 3D image series of selected subplug(s) through restoration and wettability centrifuge lab workflow
- Analysis of imaged fluid distributions for Pc(Sw) curves and contact angles
- Simulation of kr (Sw) in each imaged fluid.
Applications & Advantages
- Sample size up to 2.5” diameter core
- VCORE with micro-CT imaging and analysis algorithms give more sensitive, quantitative fracture detection than medical CT pre-screening, and correlates 3D mineral and fracture distributions
- Non-destructive quality check before lab RCA and SCAL or after each lab step, on preserved, cleaned or restored states
- Quantification of fracture network and interfacial area per mineral from lab fracking tests on unconventionals.
Deliverables
- VCORE with micro-CT imaging and 3D mineral mapping on core plug in one, or a sequence of, received states.
- 3D segmented map of natural or induced fractures, with 3D visualizations and client viewer
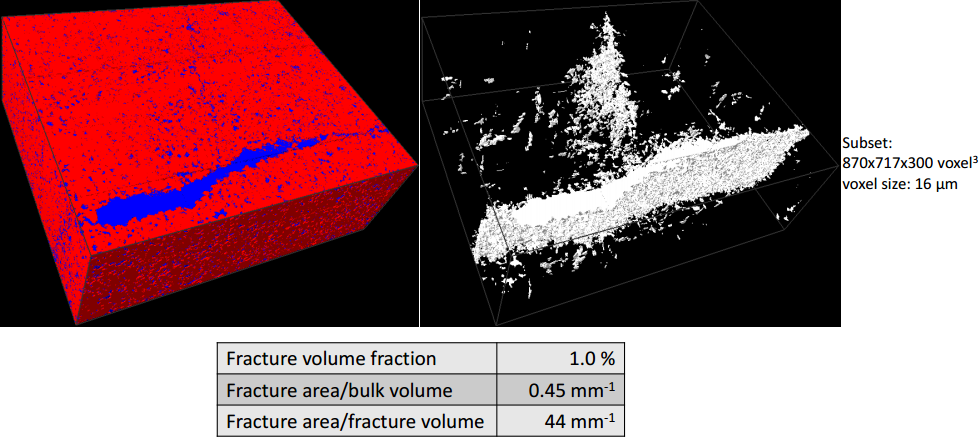
- Fracture volume, area and connectivity statistics and fracture-mineral correlations
- 3D image registration between states to quantify formation and growth of fractures and other damage due to lab processes.
VFRACTURE Example: Fractured reservoir sandstone core plug
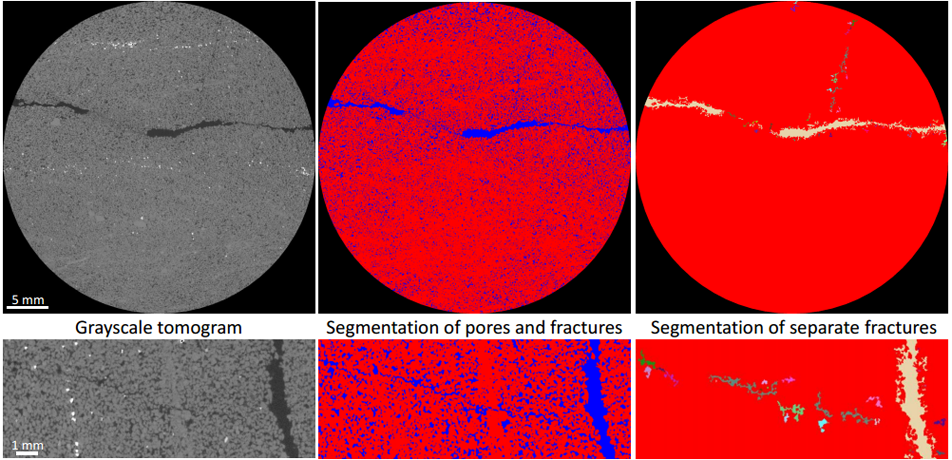
VFRACTURE Example: Fractured reservoir sandstone core plug
Applications & Advantages
- Unique characterizations of tight oil and tight gas samples beyond the scope of lab measurement
- VCORE 3D maps of mineralogy, porosity and microfractures enable representative selection of FIB-SEM imaging sub-volumes and upscaling of simulated transport properties to plug scale
- 3D maps of in-place fluids (water and nonaqueous phase) and imaged dynamic transport experiments used to validate simulations and pinpoint targets and strategies for hydrocarbon recovery.
Deliverables
- VCORE with micro-CT imaging and 3D mineral mapping of plug or sub-plug with selective contrast enhancement for quantitative 3D segmentation of:
- Connected porosity (from all pore sizes)
- Microfractures and slot-like pores, including apertures (of all sizes)
- In-place fluids in preserved samples
- Imaged dynamic experiments such as diffusion and spontaneous imbibition
- Distribution statistics and correlations of porosity, microfractures, in-place fluids, transport to mineralogy and morphology.
Applications & Advantages
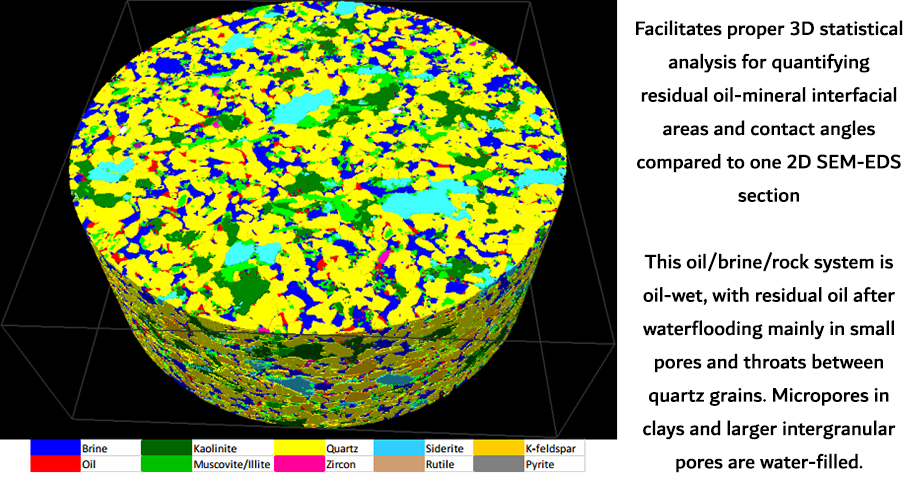
- Unique 3D pointwise-correlated characterizations, without sample variability, of imaged changes in solids and fluids from plug- to pore-scale, due to lab testing (by client, RRT or third party) of:
- Drilling mud infiltration
- Well stimulation processes
- Formation damage, e.g. due to waterflooding
- EOR processes
- VCORE provides platform for nondestructive 3D mapping of minerals and correlations with imaged experiments.
Deliverables
- VCORE with micro-CT imaging and 3D mineral mapping of plug or sub-plug registered and analyzed before/after lab processes
- 3D visualizations and client viewer for direct comparison of changes to same individual features down to pore-scale throughout sample
- Size distributions of resolved grains, pores and throats per mineral in multiple states
- Property (e.g. permeability) simulation in multiple states.
VFLOOD Example: Recovery from Restored Reservoir Sandstone 2
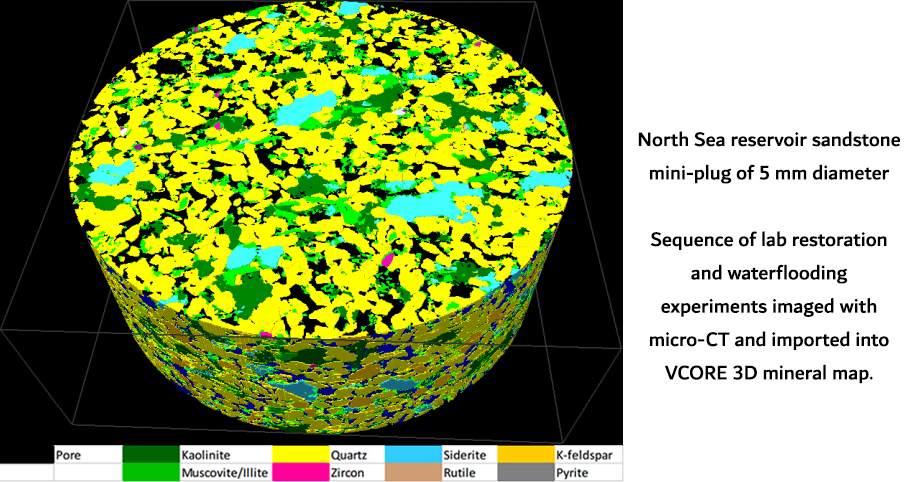
VFLOOD Example: Recovery from Restored Reservoir Sandstone 2
We Want to Make Conventional Labs 6σ.
Our Vison is 3.4 mistakes a Million.